Let’s take a normal day.
You may wake up in the morning and look at your email or Facebook. At work, you might pick up your phone and look at Facebook over lunchtime. Then after dinner, you might browse to see what’s new.
If one of your friends wanted to share an interesting article with you, when are you ideally read it?
If you’re a morning person, perhaps you’d prefer to view the article early in the morning when it’s quiet.
Perhaps you’d ideally like to spend ten minutes reading it during your lunch break. Maybe it’s nice to read and think about something important when you’re not testing.
If you get more done in the evening, perhaps you’d read your friend’s interesting article at night.
Can Facebook Tell You?
If you have over 30 likes on your Facebook Page, you can find out the most frequent times that your patients are online. That is, those patients who’ve liked your Page.
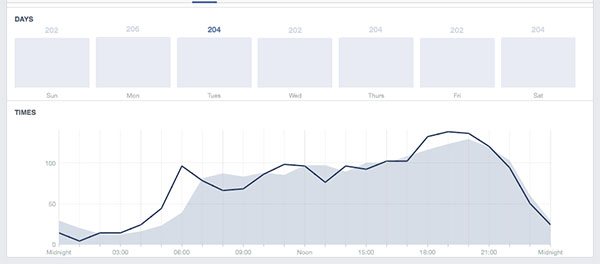
Go to your Facebook Page, then click Insights, then Posts and scroll down until you see a graph like this:
From this graph, hover your mouse over the most popular times that your patients are on Facebook.
You can also hover over the different days of the week. This allows you to see how weekdays differ from weekends. (The weekly average is filled with blue, with an individual day being an individual dark-blue line.)
The Survey Says
Sensis Social Media Report 2015 surveyed 800 Australian Consumers. According to the survey, 49% of respondants access Social Media every day.
The most common times to be online were:
- First thing in the morning
- Last thing before I go to bed
- After work in the evening
Patient Demographics and Social Media
Not surprisingly, accessing Social Media occurs at different times for different age groups.
18-29 year old respondents were more likely to access Social Media almost any time of the day. This reduces slightly when commuting or at lunch.
For age brackets, 30-39, 40-49, 50-64 and 65+, progressively fewer respondents access social media during the day.
(However, between 2011 and today, significantly more respondents accessed social media at least once per day, and fewer said that they never access social media.)
But, where do people use Social Media?
Across all age groups, 93% of respondents say that they use social media at Home. This is followed by 32% at Work, and 26% on Public Transport.
In the home, 72% of respondents say that they use social media in the Lounge/Living Room, followed by 43% in the bedroom or study.
Facts
- Metro and Regional respondents accessed social media with similar frequency. Regional respondents used social media less frequently during Commuting and During Work.
- Tasmanian respondents had the most frequent use of social media. WA respondents were the least frequent.
Summary
Using Facebook Insights, Sensis Survey and your intuition, you can discover the most likely times that your ideal patients are using social media.
Perhaps your ideal patient is a 30-39 year old female. She typically logs onto Facebook first thing in the morning, after work or in the evening, or last thing before going to bed. She may live in Metro Tasmania, and likes to log in from Home in her Loungeroom.
Use this information to plan the times for your next post. You’ll likely see more people liking or commenting on your posts. This will grow your Page, Community and Practice.


